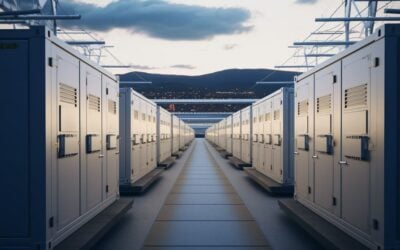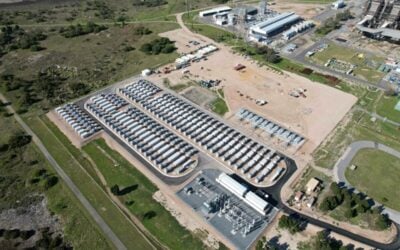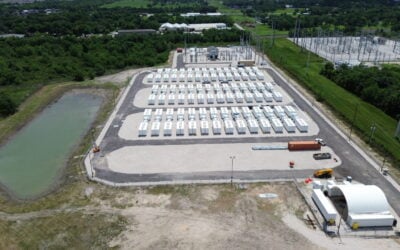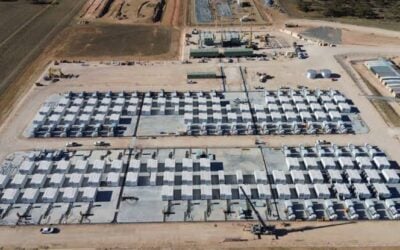
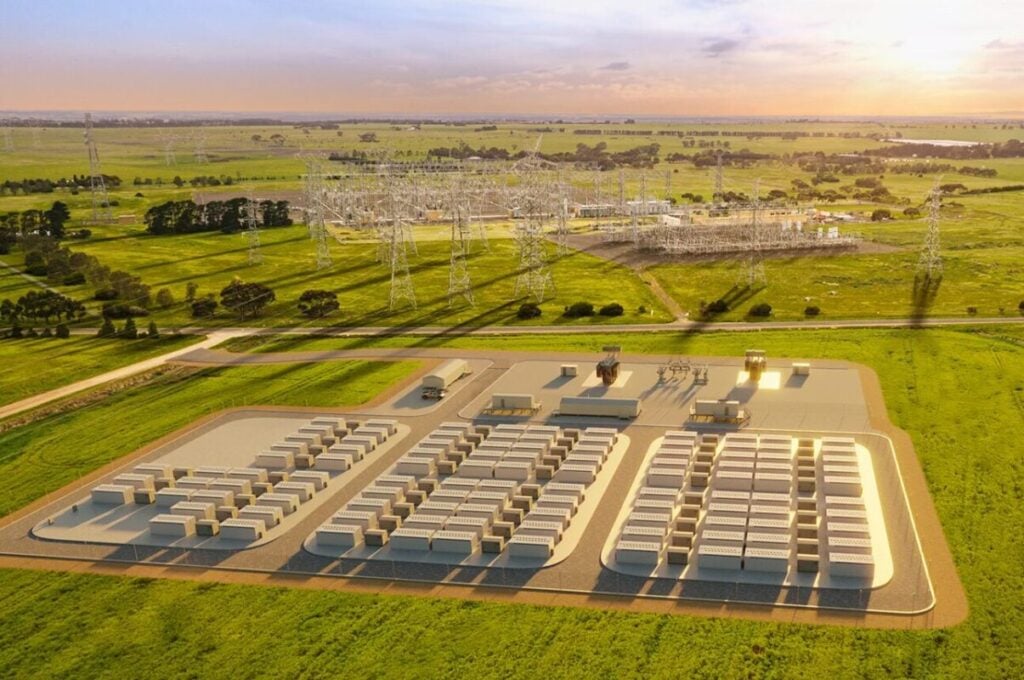
NEM-wide battery price spreads fell 85% in a single year to average AU$51/MWh (US$35/MWh) in Q2 2026, as grid-scale battery storage capacity in Australia’s National Electricity Market passed 9,000MW for the first time, according to the Australian Energy Market Operator (AEMO) Quarterly Energy Dynamics report for Q2 2026.
Between the end of Q2 2025 and the end of Q2 2026, 4,640MW/12,353MWh of battery storage systems began commissioning across the NEM.
Of that, 951MW/2,753MWh came online during Q2 2026 alone, including the 300MW/1,200MWh Stanwell BESS and the 222MW/593MWh Woolooga BESS, both in Queensland, alongside the 240MW/590MWh Mornington BESS in Victoria and the 180MW/360MWh Broadsound Energy Park in Queensland.
The fleet’s growing scale is now visible in market outcomes. Average battery discharge in Q2 2026 reached 476MW, almost triple the 162MW recorded in Q2 2025, while average charging rose 182% year-on-year to 574MW.
Try Premium for just $1
- Full premium access for the first month at only $1
- Converts to an annual rate after 30 days unless cancelled
- Cancel anytime during the trial period
Premium Benefits
- Expert industry analysis and interviews
- Digital access to PV Tech Power journal
- Exclusive event discounts
Or get the full Premium subscription right away
Or continue reading this article for free
That charging activity was concentrated in the daytime window between 1000 and 1600 hours, when solar generation is at its highest and prices are typically at their lowest, with daytime charging reaching 1,009MW, up 211% year-on-year.
Evening discharge between 16:00 and 21:00 hours rose by 1,066MW, or 228%, over the same period, with the fleet absorbing cheap midday solar and releasing it during the demand peak.
Peak battery charging set a new record of 3,653MW on 7 June, surpassing the previous record of 2,834MW set in Q4 2025 by 819MW. Peak discharge also reached a new high of 3,759MW on 26 June, 203MW above the previous record set in Q1 2026.
Battery storage systems became the most frequently used price-setting technology in the NEM during Q2, accounting for 36% of dispatch intervals, up from 17% in Q2 2025.
Battery discharge set prices in 46% of dispatch intervals during the evening peak period, up 24 percentage points year-on-year, displacing gas and hydro as the dominant price-setter in those hours.
Gas-fired generation, by contrast, averaged just 1,050MW across the quarter, its lowest Q2 output since 2003, with average discharge in the evening peak 1,441MW lower than in Q2 2025 as batteries absorbed the role that gas had previously filled in managing peak demand.
The shift contributed to a 47% fall in NEM-wide average wholesale spot prices to AU$74/MWh, the lowest Q2 average since 2020. Increased renewable energy generation and lower evening peak demand also contributed to the decline, with the renewables share of NEM generation reaching a new Q2 high of 42.1%, up from 37.1% in Q2 2025. Wind generation reached a new Q2 high of 4,198MW, up 20% year-on-year, while coal-fired output fell to a new Q2 low of 13,158MW, down 5% from Q2 2025.
Queensland recorded a wind generation record, with average output rising 80% to 842MW.
This followed a pattern established in the first quarter of the year, when AEMO’s Q1 data showed battery storage systems had more than tripled their daily energy shifting compared to the same period in 2025, with average discharge reaching 359MW against 98MW in Q1 2025.
The Q2 figures show that the trajectory is continuing at pace, with each successive quarter adding substantially to the volume of energy the battery storage fleet shifts.
Home battery adoption also accelerated during the quarter, supported by the Australian government’s Cheaper Home Batteries Program.
Cumulative household battery capacity under the program reached 11,321MWh across 389,137 installations by the end of June 2026, up 41% from the end of Q1 2026. It should be noted that Australia’s climate change and energy minister, Chris Bowen, claimed in May that the programme had surpassed 400,000 installations.
The programme’s effect on grid demand patterns was measurable. AEMO said that households with both solar and battery storage systems reduced their evening peak imports by an average of 0.7kW per household compared to solar-only households, equivalent to a 73% reduction in net grid imports during the 16:00 to 21:00 hour window.
Revenue pressure mounts as price spreads narrow
The same dynamics driving battery storage systems deeper into market operations are compressing the revenue available to them.
Estimated net battery revenue in Q2 2026 fell to AU$57.5 million, down from AU$130.5 million in Q2 2025, a decline of AU$73 million in a single year. The primary cause was a collapse in energy arbitrage margins, with the NEM-wide average price spread between charging and discharging falling from AU$342/MWh to AU$51/MWh across the year.
Net arbitrage revenue dropped 56% to AU$52.8 million, with gross energy revenues falling AU$44.5 million to AU$106.2 million while charging costs rose AU$23.6 million to AU$53.4 million. FCAS revenue fell 51% to AU$4.8 million, though it accounted for a slightly larger share of total battery storage revenue at 8.3%, up 0.8 percentage points year-on-year.
The revenue declines varied by region. Victoria recorded the largest reduction in arbitrage revenue, down AU$32.7 million, followed by South Australia, down AU$17.8 million, and New South Wales, down AU$13.5 million.
Queensland’s decline of AU$4 million was comparatively modest, partly reflecting South Australia’s price event on 21 and 22 June, when a three-day wind lull combined with transmission constraints to push prices above AU$10,000/MWh across multiple intervals and briefly to the market price cap of AU$20,300/MWh.
Following the price event in South Australia, ESN Premium spoke with OptiGrid CEO Sahand Karimi on why some assets performed better than others.
The pattern of falling revenue is consistent with what is happening in global battery markets as installed capacity scales rapidly. As more batteries compete to charge during periods of low prices and discharge during high-price evening peaks, those price differentials narrow.
The NEM’s intraday price profile flattened materially in Q2 2026, with evening peak prices well below Q2 2025 levels, thereby reducing the arbitrage spread available.
Volume-weighted average prices for battery discharge fell from AU$427/MWh in Q2 2025 to AU$101/MWh in Q2 2026, a decline of AU$326/MWh in a single year, showcasing how quickly the economics of purely arbitrage-focused battery operation can shift in a market where capacity is growing at this pace.
As previously reported by Energy-Storage.news, Australia is now the world’s third-largest utility-scale battery storage market, positioned behind only the US and China, with 4.3GW of large-scale battery systems reaching financial close in 2025. That scale is reflected in the NEM connection pipeline, which grew 42% over the past year to 75.4GW, with batteries accounting for 53% of total capacity in progress.
Of the 39.6GW of battery storage systems in the pipeline, 74% feature grid-forming inverters, which provide synthetic inertia and system strength services as coal-fired generation progressively exits the market.
Grid-forming capability has become increasingly commercially attractive as the NEM’s need for system-strength services grows, providing a revenue stream that sits outside the arbitrage market where margins are compressing.
In Q2 2026, a record 6.9GW of new connection applications were approved across 32 projects, with battery storage projects accounting for 3.6GW of that total, followed by 1.8GW of solar-plus-storage, 1.3GW of wind and 0.2GW of solar.
The application pipeline itself more than doubled across FY26, from 17.5GW to 35.3GW, with battery projects also noted as the fastest technology to move through the connection process.
However, AEMO’s data flags a growing challenge in the developer-led proponent implementation stage, where the median project duration increased from 14 months to 18 months over the year, and nearly one-third of projects in that stage have now been there for more than two years.
Design changes, equipment substitutions, extended financing processes and project sales are all cited as contributing factors.
Alongside those pipeline dynamics, 17 data centre load connection projects with a combined maximum connection capacity of 9.0GW are now working through the transmission network connection process, with 52% of that capacity in New South Wales, 31% in Victoria and 17% in South Australia.
The Australian government has moved to legislate a requirement that large-scale data centres be net generators of renewable energy rather than net consumers. This policy is expected to accelerate the deployment of co-located battery storage alongside data centre construction as operators seek to meet that obligation.
The revenue picture adds commercial weight to the broader delivery question. AEMO’s 2026 Integrated System Plan calls for 35GW of short and medium-duration storage alongside 5GW of long-duration storage by 2050 to support a grid increasingly powered by variable wind and solar.
Meeting that target while maintaining investable returns will require battery assets to diversify beyond energy arbitrage into system services, longer storage durations and new revenue structures.
Never miss an Australian energy storage story. Sign up for our Australia newsletter and get the latest project announcements, policy updates and market analysis delivered directly to you.
Our publisher, Solar Media (part of Informa Group), will host the Battery Asset Management Summit Australia 2026 on 25-26 August at Amora Hotel Jamison in Sydney. You can find out more about the Summit on the official website.