
Analysis of optimiser performance in the Dutch electricity market highlights the need to separate claims and forecasting from realistic outcomes, writes Omer Bumin of trading infrastructure software company Powerlys.
On 183 days of real Dutch market data, the same renewable energy asset earned 13.3% more, about €145,000 (US$161,500), when an optimiser replaced simple threshold rules. Against a competent one-cycle battery schedule, the kind a careful desk runs by hand, the optimiser’s edge was 1.7%, about €20,000. Both numbers are true, and this article is about why you need both before you believe either.
The asset never changed: 8MWp of solar, 6MW of wind and a 5MW/10MWh battery energy storage system (BESS) behind a 15MW grid connection. Only the dispatch decisions did.
Why the market stopped forgiving
For most of the subsidy era, mediocre dispatch was free. A feed-in premium flattened the price signal, imbalance was a rounding error, and a spreadsheet plus a weather feed was enough. That market is gone.
Try Premium for just $1
- Full premium access for the first month at only $1
- Converts to an annual rate after 30 days unless cancelled
- Cancel anytime during the trial period
Premium Benefits
- Expert industry analysis and interviews
- Digital access to PV Tech Power journal
- Exclusive event discounts
Or get the full Premium subscription right away
Or continue reading this article for free
Dutch imbalance dynamics have shifted structurally. The share of settlement periods in Regulation State 2, where the system is regulated in both directions and imbalance is most punishing, rose from roughly 8% in 2023 to 31.8% by June 2025. The Netherlands logged 963 negative-price hours through July 2025, and imbalance prices have reached +€3,990 and -€1,310 per MWh. As SDE++ gives way to merchant exposure, the gap between what an operator commits and what it delivers settles at those prices, every 15 minutes.
Many 5-50MW operators still dispatch with fixed schedules, morning adjustments and rules of thumb. The question, now, is “what does that cost?”
The experiment
From 12 April to 11 October 2026, we ran four dispatch strategies on the same asset, day by day:
- Threshold rules: charge or curtail when prices go negative, discharge into high prices, otherwise export. The spreadsheet, formalised.
- A one-cycle desk heuristic: each day, charge in the two cheapest hours and discharge in the two most expensive, if the spread pays. A competent human routine.
- An expected-value optimiser: a mixed-integer program that maximises revenue against the price forecast.
- A tail-risk planner (CVaR), built to limit bad days rather than maximise the average one.
Every Euro was settled at real prices: Dutch day-ahead for exports, transmission system operator (TSO) TenneT’s production imbalance prices for any shortfall or surplus, and the day-ahead price for any power drawn from the grid. Each strategy planned on a simple forecast (yesterday’s prices) and was paid at today’s. Every percentage below comes with a 95% interval from a paired, day-by-day bootstrap, so a reader can see how much of it is noise.
The market was spiky. In the first 79 days alone, measured on 7,680 production settlement periods, the short imbalance price averaged €118/MWh, with a 99th percentile of €445, extremes from -€1,656 to +€3,981, and a negative short price in about 11% of periods.
Finding 1: Most of the gain is a battery cycle, not an algorithm
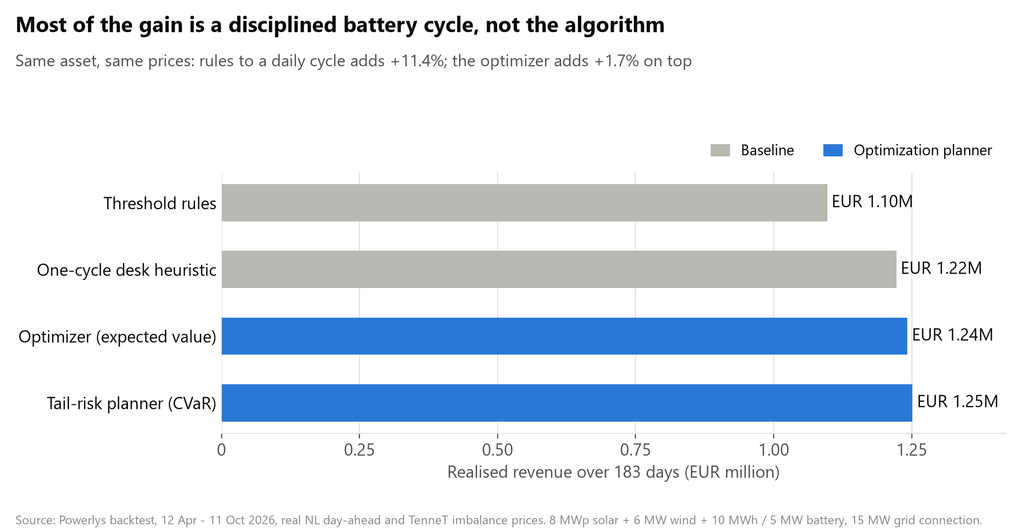
Over 183 days, realised revenue was €1,097,000 under threshold rules, €1,222,000 under the one-cycle heuristic and €1,242,000 under the optimiser.
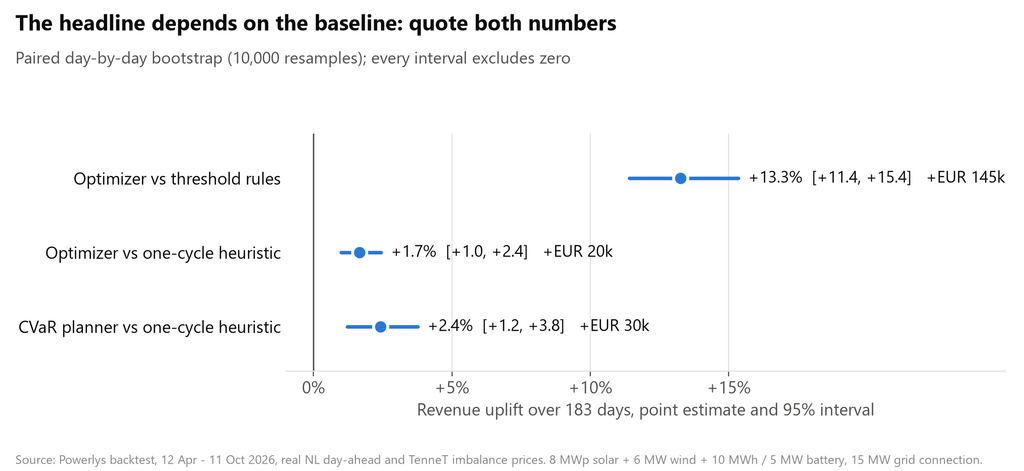
– Optimiser vs threshold rules: +13.3% [+11.4%, +15.4%]
– Optimiser vs one-cycle heuristic: +1.7% [+1.0%, +2.4%]
The large gap is almost all one thing: threshold rules use the battery reactively, while a daily cycle planned against the price shape uses it on purpose. Moving from rules to a disciplined daily cycle captures most of the value. The optimiser adds 1% to 2% on top. That margin is real, since the interval excludes zero, and on this asset it is worth roughly €40,000 a year. But it is not 13%.
This is why we never quote the large number on its own. An operator who already runs a careful daily routine should expect the smaller one. An operator still on rules of thumb is looking at the larger one, and most of it does not need an optimiser at all.
Imbalance was not the story either. Every strategy paid real imbalance costs, about 2-3% of revenue, and the differences between planners were small next to the revenue gaps.
Finding 2: The ‘insurance’ planner came out on top, for a Dutch reason
The tail-risk planner earned the most of all four: +2.4% [+1.2%, +3.8%] over the one-cycle heuristic. That reverses what we reported on an earlier, shorter window, and the reason matters more than the ranking.
The CVaR planner commits less than it expects to produce. In the Netherlands the surplus is not wasted: TenneT pays for it at the long imbalance price, which in our data averaged about 93% of day-ahead. Passive balancing is legal and paid. So a planner that under-commits gives up very little and avoids costly shortfalls. On the part the planner actually decides, delivered energy at the real price, it is 2.3% behind the heuristic; it wins on the surplus.
That is a feature of Dutch market design, not a general law. In a market where surplus is paid much less, the same planner would look worse. What travels is the principle: the right dispatch strategy depends on how your market settles surplus and shortfall, and a backtest that ignores the settlement rules will pick the wrong one.
Finding 3: Better price forecasts are worth less than you think
On the first 117 days we replaced the forecast with perfect knowledge of the next day’s prices. On delivered energy, the optimiser’s edge over the heuristic rose by only about 1 percentage point. A simple forecast already captures more than half of what perfect foresight could. For a mid-market operator, a sophisticated price model is not the first purchase.
What it took to measure this honestly
Our first version of this analysis, on 79 days, reported +14.0%. Since then we found and fixed three errors in our own evaluator: batteries were credited without an energy budget, surplus energy was paid nothing, and grid charging was not always charged. We added the confidence intervals that were missing. Each fix moved the numbers, and we published each correction when we found it.
The headline against threshold rules held at around 13%. The more useful finding is the second number, which our first version did not report at all.
The boundary stated plainly: generation in this backtest is modelled from physics and weather, not metered telemetry. It is a single hybrid asset, and the window runs from spring to autumn, with no winter scarcity. It is a market-price backtest, not a field trial.
What this means and what happens next
None of this requires exotic infrastructure. The inputs are day-ahead prices, generation forecasts, asset limits and the settlement data the TSO already publishes.
It does suggest the right question to ask any vendor, including us: “Backtest on my portfolio with real prices on both legs, against what I already do, and show me the interval.”
A number against a strawman baseline, or a number without an interval, is marketing.
The missing piece is metered reality, which no simulation replaces. That is the pilot stage: a shadow pilot on the operator’s own data, recommendations only, at no cost and easy to end.
About the Author
Omer Bumin is the founder of Powerlys. Powerlys provides decision infrastructure for European balancing-responsible party (BRP) dispatch, validated on live Dutch market data since April 2026. It ingests live market data and produces 15-minute PTU dispatch decisions: charge/discharge schedules for energy storage, curtailment for solar PV and wind, imbalance-aware grid import/export targets for 5-50MW asset operators.