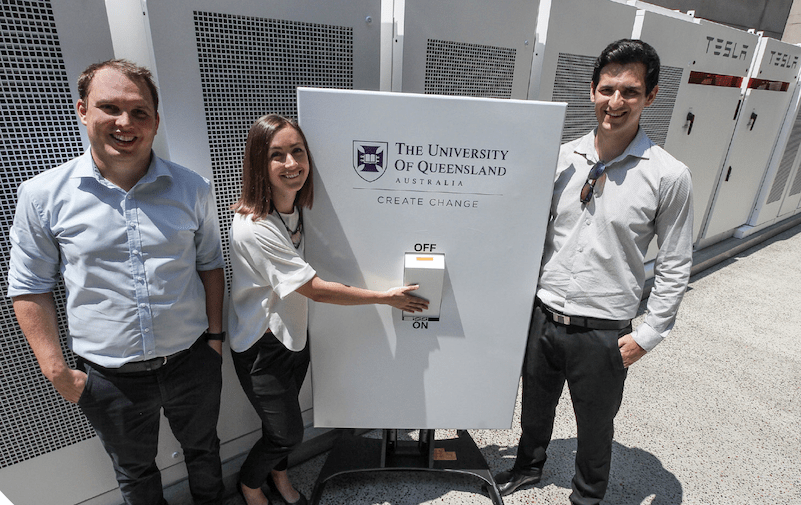
The business case for behind-the-meter (BTM) battery storage in Australia appears to be positive, according to a University of Queensland report on the performance of a 1.1MW / 2.15MWh Tesla battery energy storage system (BESS).
A project team at the university released the results of the first quarter of operation of a Tesla Powerpack which was installed towards the end of 2019 and then put into service delivering stacked revenue streams from four different services: arbitrage, peak demand lopping, contingency frequency control ancillary services (FCAS) and a virtual cap contract. The latter is a means of hedging the University against the risk of electricity spot market price volatility.
Enjoy 12 months of exclusive analysis
- Regular insight and analysis of the industry’s biggest developments
- In-depth interviews with the industry’s leading figures
- Annual digital subscription to the PV Tech Power journal
- Discounts on Solar Media’s portfolio of events, in-person and virtual
Putting 10 of Tesla’s 215kWh commercial and industrial (C&I) Powerpacks and pushing it to 100% of nameplate depth of discharge, the total project cost AU$2.05 million (US$1.34 million), or AU$954/kWh, which the University of Queensland (UQ) was able to pay for from money earned through renewable energy credits from solar systems.
The system accrued AU$74,000 across the four services in the three months it was assessed for, with FCAS the standout leader (AU$46,000), the virtual cap contracts at just under AU$20,000 and arbitrage earning around AU$8.5k, while peak lopping was not an applicable service in the quarter as the system was not yet ready in time to perform this capability, but will be for future reporting.
UQ noted that the behind-the-meter system's performance had exceeded financial expectations by 20%. UQ did note that FCAS overperformed by 54% over expectation, due to bushfires and storm events which meant behind-the-meter storage performed more frequency control than had been anticipated.
The table below shows key performance figures. Note that the round trip efficiency figure given of 84.5%, while slightly lower than the manufacturer's stated 86.5% under nominal conditions, includes auxilliary load and is impacted by the percentage of capacity the battery started and ended the quarter with, while Q1 in Queensland includes the year's hottest months and therefore the highest auxillary cooling load requirements.
UQ said that while one quarter alone is not a large data set to consider and that past performance may not be an accurate indicator of future performance, the results are “nonetheless a promising indication that the battery remains on track to meet or exceed its forecast 8-year payback”. There may also be future revenue streams that open up, such as markets for virtual inertia or fast frequency response. See the team's full report here.
A recent report from the Australian Energy Market Operator (AEMO) on South Australia's virtual power plant (VPP) project, which came out a few weeks ago in April and assessed the performance of aggregated residential battery storage systems from July 2019, also showed that behind-the-meter batteries could provide significant revenues, especially where FCAS services were involved.
| Key metrics for the quarter’s operation of the 1.1MW / 2.15MWh BESS | |
|---|---|
| Total MWh charged | 107.70 MWh |
| Total MWh discharged | 90.98 MWh |
| Round trip efficiency* | 84.5% |
| Average charge price | AU$43.20 per MWh |
| Average discharge price | AU$149.98 per MWh |
| Average ‘spread’ | AU$106.77 per MWh |
| Charge price vs average spot price | -20% |
| Discharge price vs average spot price | +178% |
| Battery availability/uptime | 94.3% |
| Capacity factor (discharging only) | 3.8% |
| Capacity factor (charging + discharging) | 8.3% |
| Number of contingency FCAS events | 12 |
| Response duration of FCAS contingency events (total) | 42 minutes, 36 seconds |
