
Experts at consultancy Apricum examine with some simple “reverse engineering” how recent low solar-plus-storage PPAs in the USA were achieved, yet another example of the competitiveness of energy storage and new market opportunities emerging via storage-plus-renewables projects.
By Florian Mayr, partner and head of the energy storage and green mobility practices, Hannes Beushausen, principal, and Oliver Schmidt, senior consultant, at Apricum – The Cleantech Advisory, March 2020
Over the past few years, a series of renewables-plus-storage projects announced across the USA created headlines and raised eyebrows due to the extremely low combined PPAs involved. Starting in 2015 with a US$139 /MWh PPA signed by KIUC of Hawaii, we then saw the next landmark reached in 2017 with a US$45 /MWh agreement by Tucson Electric Power of Arizona – only to be surpassed last year by the US$40 /MWh Eland PV-plus-storage project in California.
Comparing that to the generation costs of a conventional peaker easily reaching US$200 /MWh, PV-plus-storage makes an increasingly compelling case. It’s no big surprise, therefore, that around 40 of these systems are already in operation in the USA, combining about 533MW of storage with 1,242MW of solar capacity, mostly in California, Hawaii and Florida, as reported by the Institute for Energy Economics and Financial Analysis (IEEFA).
Try Premium for just $1
- Full premium access for the first month at only $1
- Converts to an annual rate after 30 days unless cancelled
- Cancel anytime during the trial period
Premium Benefits
- Expert industry analysis and interviews
- Digital access to PV Tech Power journal
- Exclusive event discounts
Or get the full Premium subscription right away
Or continue reading this article for free
To understand energy storage’s contribution to this boom, we need to break down the combined PPA into a solar and a storage share. Let’s take the aforementioned Eland project for example, in which the PPA without storage would have amounted to US$20 /MWh (“base” price) and a US$20 /MWh “adder” was offered for the storage system, resulting in a PPA of US$40 /MWh for all MWhs delivered. While a PV LCOE at this level is no big news anymore, US$20 /MWh for energy storage seems absurdly low. How is such a low storage adder possible, you might ask, considering that LCOS (Levelised Cost of Storage) is very likely to remain above US$100 /MWh for the next couple of years?
We asked ourselves the same question and decided to drill down into the Eland project (above), consisting of 400MW of PV (AC) and 300MW / 1,200MWh of energy storage located in the Californian Mojave desert, to find the answer.
Reverse-engineering the actual remuneration for the storage system
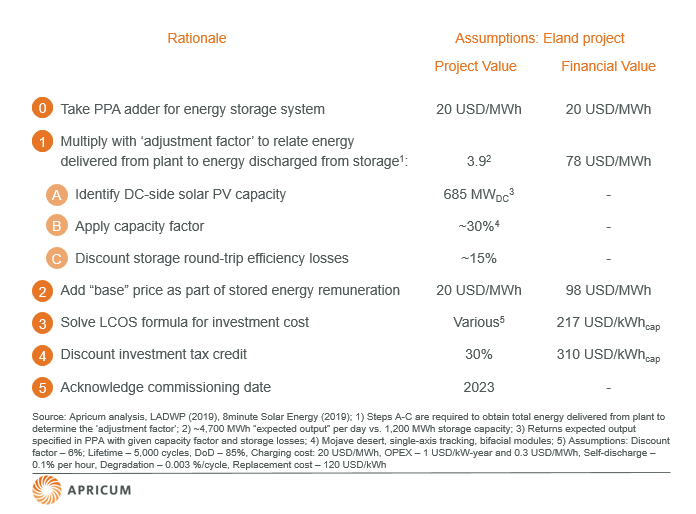
It is important to understand that the storage adder component of the PPA should not be compared to the LCOS as it is not equal to the actual remuneration for the energy provided by storage. To put the adder into relation to storage costs, we need to “reverse-engineer” this remuneration per MWh, i.e., how much is paid for each MWh discharged from the energy storage system, and we can do this in five steps.
Firstly, we need to account for the fact that the storage adder is paid for all MWhs delivered by the project, not only for the MWhs discharged from the storage system. Taking a sample day from the Eland project, the amount of energy discharged from storage (1,200MWh [1]) is significantly smaller than the amount of energy delivered by the solar-plus-storage system in total (4,700MWh [2]), i.e., the energy for which the project is remunerated. In other words, the renumeration for 1 MWh of stored energy is distributed over several MWh delivered by Eland in total, in this case, 3.9MWh. Hence, the ratio of total energy remunerated over energy discharged from storage, 3.9, needs to be multiplied with the storage adder to calculate the actual remuneration for energy discharged from the storage system. That results in an “adjusted adder” per energy from the energy storage system of US$20 USD/MWh * 3.9 = US$78 /MWh.
Secondly, we have to add the US$20 /MWh “base” price, because the energy discharged from the storage system will also receive the solar-only component of the PPA price. This means the actual remuneration for every MWh discharged from the storage system is US$98 /MWh.
Deriving underlying energy storage CAPEX
But what are the underlying assumptions for the capital cost of the energy storage system? To derive these, we now assume that the remuneration for each MWh discharged from the energy storage system is equal to the LCOS at an assumed discount rate. We apply a 6% discount rate and various other technical and economic assumptions for the energy storage system (listed in Figure 1 below). The third step in our approach, is to solve our LCOS formula [3] for the CAPEX of the energy storage system, giving us a value of approximately US$217 /kWhcap.
As the fourth step, we now need to discount the investment tax credit (ITC) granted to account for any investment cost subsidies. Originally a financial incentive for solar in the USA, the ITC also applies to an energy storage system if it is charged by the adjacent PV plant only. Because 8minute Solar Energy began building a substation for the project in 2019 it can still claim a 30% ITC (for a construction start in 2020 it would only be 26%), significantly decreasing the effective capital cost of the energy storage system. Accounting for this local incentive, we end up with a CAPEX of 310 USD/kWhcap.
While this is still a very low value for an installed battery storage system, it is important to acknowledge that the plant is meant to be operational only by 2023 – the fifth and final step in our reverse-engineering exercise. In this timeframe, US$310 /kWhcap is within the range of aggressive, but realistic quotes we observe in the industry.
Figure 1 below provides a summary of our approach to calculating the actual remuneration and CAPEX for energy storage systems in solar-plus-storage plants, incorporating all the factors described above.
Solar-plus-storage is here to stay
Although the storage adder of US$20 /MWh should not be compared to LCOS or confused with the actual higher remuneration, our reverse-engineering demonstrates how very low combined PPAs for solar-plus-storage can in fact be realized already today. Necessary prerequisites are excellent conditions for renewable energy, a sufficiently high ratio between total energy output of the plant and storage capacity, local incentives (for now) and a continued decline in energy storage system costs. In particular, the latter will help unlock further markets for renewables-plus-storage, eventually also those with less solar irradiation, no strong government support and where longer discharge durations are required to replace fossil fuel-based generation.
A new opportunity for energy storage has just started to emerge – and it is going to be a sizeable one.
Footnotes: [1] We implicitly assume daily charge and discharge, which is a valid simplification given that solar-plus-storage plants are designed to shift daytime energy generation to afternoon/evening hours.
[2] This value is taken from the agreement between LADWP and 8minute Solar Energy from August 8, 2019; we assume this value is achieved through a high inverter loading ratio (e.g., ~1.7, so 400 MWAC inverter is installed for 685 MWDC solar panels), very good solar resources (30% capacity factor in Mojave desert with single-axis, bifacial tracking PV panels) and a storage round-trip efficiency of 85%. It is assumed that due to the storage system all energy produced by the total 685 MWDC solar panels can be utilized, i.e. no ‘clipping’.
[3] For further explanation, see Apricum’s 2016 article on this site on how to determine the costs of energy storage.
Cover Image credit: 8minute Solar Energy.