From 2016 onwards, the UK energy markets’s appetite for battery energy storage systems (BESS) has grown and grown, making it one of the leading centres of activity in the global market today. Solar Media Market Research analyst Mollie McCorkindale offers an insight into that trajectory and illustrates where the market is today.
Utility-scale energy storage activity in the UK saw strong growth during 2021 with annual deployment growing 70% compared to 2020. Additionally, the pipeline of future projects increased by 11 GW to over 27 GW by the end of 2021.
This article discusses the factors behind the recent growth of the UK utility-scale energy storage market and what led to the strong annual deployment last year.
Strong growth of installed capacity during 2021
Previously, 2018 had the highest annual installed capacity of utility-scale energy storage in the UK with 442 MW added. In 2021, deployment levels exceeded this marginally, with 446 MW, mainly across 10 large-scale sites; going forward, deployment levels are likely to see further Y/Y increases.
Try Premium for just $1
- Full premium access for the first month at only $1
- Converts to an annual rate after 30 days unless cancelled
- Cancel anytime during the trial period
Premium Benefits
- Expert industry analysis and interviews
- Digital access to PV Tech Power journal
- Exclusive event discounts
Or get the full Premium subscription right away
Or continue reading this article for free
Total installed capacity of utility-scale storage is now approaching 1.7 GW across 127 sites and the figure below shows annual installed energy storage capacity by project size.
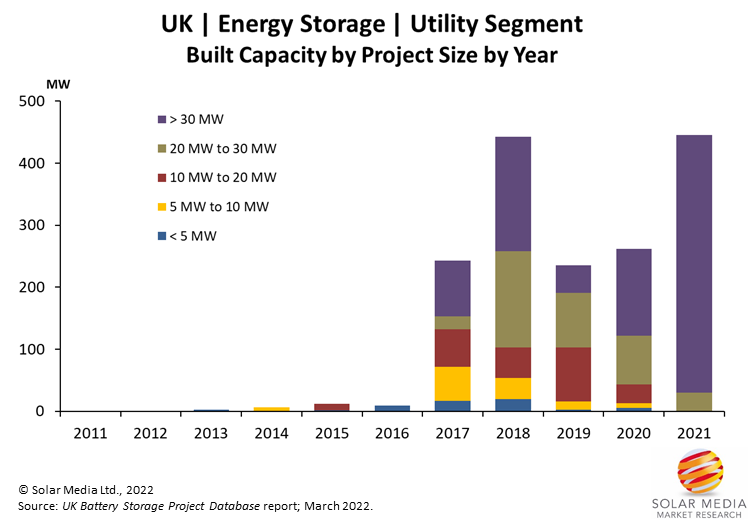
The average size of utility-scale energy storage sites has also increased. In previous years, there was more of a mix of project sizes. In 2021, the majority of sites installed were stand-alone and 7 out of the 10 key projects completed were 49.9 MW. The main projects ranged from 30 MW to 49.9 MW each, which supports the trend for large stand-alone projects to dominate installations in the future.
Focusing on average project size by annual deployment capacity, the average project size in 2017 was less than 6 MW: in 2021, the average project size was 45 MW.
Deployment levels for projects less than 5 MW has decreased, with many of these being co-located with existing wind or solar sites. There are now 56 sites of this size (less than 5 MW) installed, out of the total 127 sites; this segment makes up almost half the number of total operational sites so far. Most of these were installed between 2016 and 2018. Further growth here will likely be seen as new wind and solar farms become operational.
Operational utility-scale energy storage projects between 5 MW and 30 MW have mostly been from stand-alone sites, but are now becoming less common as average project size is increasing.
When looking at the asset owners of these operational sites, specifically in 2021, many are owned by large asset owners such as Gresham House and Pivot Power. These companies have huge pipelines of energy storage projects, which are now starting to be constructed, meaning installed capacity could rapidly accelerate in the near future.
The majority of projects deployed in 2021 were submitted into planning between 2017 and 2019 and from this we can see that there is still a large amount of pipeline submitted during this period that is still pending construction; this underlines the potential for growth in 2022 and beyond.
Substantial growth of UK pipeline during 2021
The figure below shows annual capacity of submitted applications by project size with 2021 being a record-breaking year by some margin.
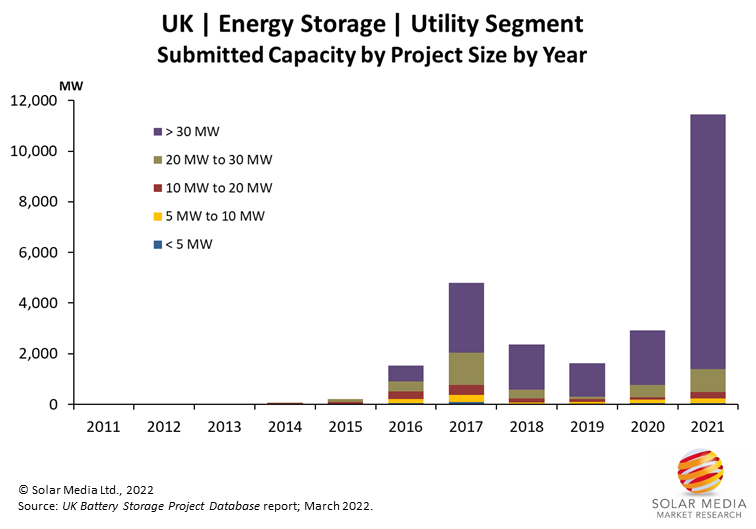
During 2021, the pipeline jumped by 11 GW to more than 27 GW, partly due to the increase in the 50 MW threshold. Another reason for this particularly high surge in applications is because companies are becoming more experienced in the services available, allowing for more attractive revenue streams. As such, the overall risks in build-out have been reduced and the key stakeholders in the market appear to understand better how to operate projects profitably.
In 2021, two pre-applications were submitted for 500 MW stand-alone sites, the largest energy storage sites seen in planning so far. Both projects are to be located in Scotland and were submitted by Alcemi Storage Developments.
Before last year, 2017 had the highest annual submitted capacity at 4.2 GW across 203 sites where the average project size was close to 20 MW. The average project size submitted in 2021 was almost 49 MW. This is mostly from large stand-alone sites but also from many smaller co-located sites. However, the average project size for co-located sites is also increasing as the overall size of co-located technologies increases also; the large-scale (>30 MW) segment also contains some co-located sites within the total capacity.
In 2021 most of the proposed projects under 30 MW were co-located with source of generation and projects above 30 MW were stand-alone. In the past, we have seen much smaller stand-alone projects and co-located projects were typically smaller than 5 MW.
So far, the market has been dominated by sites with 1 hour duration storage, with some half hour duration in early years. However, there is an increasing amount of longer duration storage sites starting to emerge within the pipeline which is partially due to the treatment of longer duration projects in the capacity market but also reflected in the access to the other services available for battery storage to participate in.
Most projects completed last year were of 1 hour duration or less and when looking at projects likely to be completed this year there are more 2 hour duration storage sites, with this trend likely to continue. In the latest results for the UK T-4 (2025-2026) Capacity Market auction, around 60% is of 2 hour duration or longer, similar to the results for the UK T-4 (2024-2025) results. Previous UK capacity auction results have been dominated by one hour duration batteries.
All these trends continue to evolve in a rapidly growing market. Average project size will continue to increase for energy storage sites and the market will remain dominated by large stand-alone sites with large capacities, although co-location with renewables will account for a larger number of projects as solar deployment in the UK increases during 2022 and beyond. Annual deployment is expected to rise each year as large-scale projects begin construction and this is shown by the large pipeline that has built up in previous years. We expect to see 2 hour duration storage becoming more prominent within the market and there is likely to be a mix of 1 hour and 2 hour duration storage with some longer duration making an appearance.
Full details of all completed and future projects are contained within the UK Battery Storage Project Database Report. To learn how to subscribe to this report, please complete your contact details at the link here.