
BESS performance guarantees are essential and ubiquitous, yet can be challenging to navigate, writes Intertek CEA senior energy storage engineer Yilin Huang.
Three years into commercial operation of an energy storage project, the annual performance test comes back below the contracted energy capacity threshold. The project has delivered less than it modelled, less than the offtaker expected, and less than the financing assumed. The developer pulls out the performance guarantee and calls the supplier.
The system integrator pulls out the contractual performance guarantee values from their degradation model.
According to that model, the system performs within the boundaries of the agreement. The contractual values hold — suppliers typically build performance guarantees around total energy throughput, a reasonable approach for the general case.
Try Premium for just $1
- Full premium access for the first month at only $1
- Converts to an annual rate after 30 days unless cancelled
- Cancel anytime during the trial period
Premium Benefits
- Expert industry analysis and interviews
- Digital access to PV Tech Power journal
- Exclusive event discounts
Or get the full Premium subscription right away
Or continue reading this article for free
Yet the project’s actual cycling pattern placed different demands on the cells than a generic throughput model assumed. The guarantee covered the total energy. It did not cover the operational stresses that real-world cycling behaviour and system conditions impose over time.
The guarantee was real. The gap between what it covered and what the project actually needed turned out to be real too.
The estimation problem: why degradation only tells part of the story
Suppliers typically build degradation models using accelerated laboratory testing: exposing cells to elevated temperatures and extreme conditions to simulate years of field wear within a much shorter timeframe. Temperature and charge/discharge rate, known as C-rate, govern this degradation process — and they reinforce each other.
Higher C-rates generate more heat; heat accelerates cell ageing. Suppliers incorporate conservative margins into their projections to protect against liquidated damage exposure.
These buffers reduce supplier risk but do not necessarily align with the developer’s interests. System sizing follows the supplier’s conservative assumptions, which can lead to oversizing and higher project costs that protect the supplier more than the project.
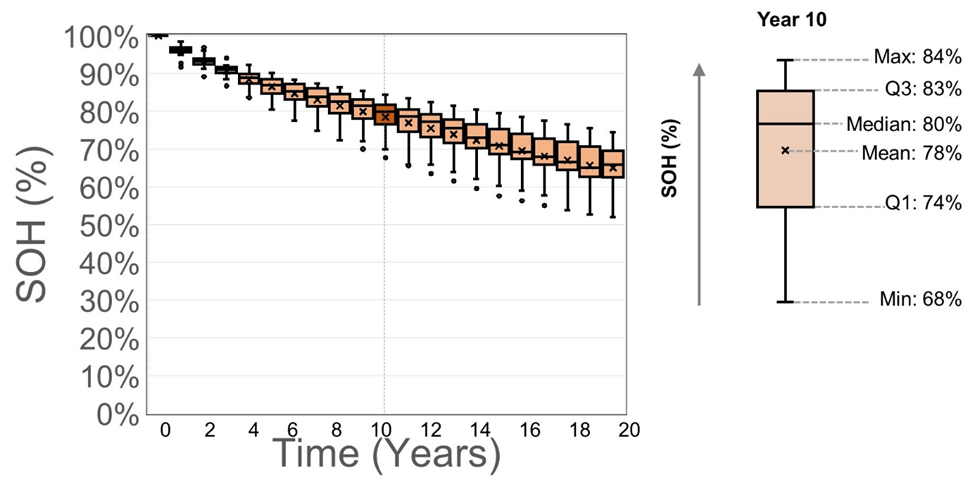
Better understanding of battery behaviour and intensifying competition have pushed performance expectations higher. Designs now exceed 10,000 cycles, extending typical project lifetimes from about 20 to 25 years.
However, these headline figures often owe more to marketing than to contractual reality — actual performance guarantees carry extensive qualifications and disclaimers. End-of-life state of health (SoH) thresholds have dropped accordingly — from 70% in older contracts to 65%, and in some cases 60%; but at 60%, disclaimers and a 25-year horizon can reduce the guarantee to a marketing claim.
Cycling assumptions: when the guarantee doesn’t fit the project
The total-energy-throughput model builds in some operational flexibility — a developer who runs half a cycle one day and two cycles the next can stay within the contracted parameters. But the application driving those cycles matters in ways the throughput figure alone does not capture.
Frequency regulation requires shallow charge and discharge cycles — injecting and absorbing energy from the grid in seconds. Energy shifting relies on deep daily discharge cycles over several hours.
These two applications drive different degradation mechanisms in the battery cells. A generic throughput guarantee ignores the difference.
A developer whose revenue model depends on frequency regulation needs to verify that the guarantee’s cycling assumptions reflect that use case — not a generic default calibrated for energy shifting. If the project’s intended application shifts over time, the original performance model may no longer apply.
Round-trip efficiency: a guarantee that moves
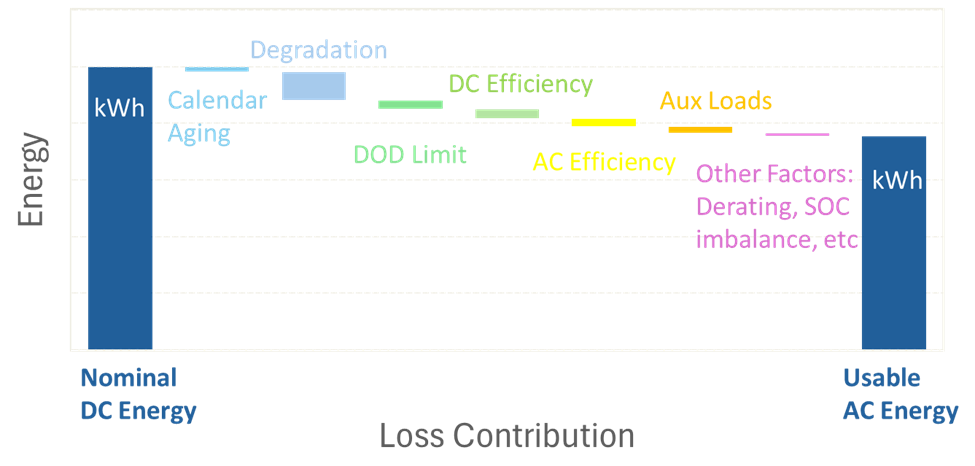
Round-trip efficiency (RTE) — the ratio of energy discharged to energy charged — determines how much of every kilowatt-hour put into the battery actually reaches the grid. It reflects the combined losses across the entire BESS: cells, DC-AC power conversion, auxiliary loads, and operating conditions over time.
As cells age, their internal impedance rises and more energy converts to heat rather than electricity with every cycle. Degradation and efficiency decline together. A guarantee that treats efficiency as a static figure may not reflect what the system actually delivers in year 10 or year 15.
Efficiency also varies with charge/discharge rate — faster cycling generates greater heat losses. A round-trip efficiency figure specified at one C-rate may not hold at the rates the project actually runs if the project operates at different C-rates.
Suppliers often exclude auxiliary loads — HVAC, thermal management systems — from their efficiency calculations, arguing those loads depend on operating conditions outside their control.
This position has merit: cooling loads swing sharply between daytime operation and nighttime standby, and ambient temperature and humidity vary by location — making auxiliary consumption difficult to guarantee, but well-defined tech exhibits can provide protection against highly dynamic real-world conditions.
Developers need to understand exactly what the stated efficiency figure includes and excludes before signing.
Availability: the hardest guarantee to model
Availability measures the proportion of time a system stays operational and ready to dispatch. In a BESS, it depends on every subsystem — battery cells, power conversion system (PCS), transformer, breakers, thermal management, battery management system (BMS), and fire suppression equipment. A single component failure can bring down a system whose battery cells remain fully healthy.
A malfunctioning liquid cooler, for example, cannot regulate cell temperature. The battery management system detects the temperature alarm and shuts the system down. The cells are unaffected. The system is unavailable.
Overall system availability depends on each major component. State-of-the-art battery containers can offer availability guarantees of around 98%, though these figures carry significant contractual qualifications. System-level availability must also account for other equipment, including the PCS and balance-of-plant (BOP) components.
A 1% drop in availability, from 98% to 97%, may appear marginal, but it represents a 50% increase in downtime, from roughly 175 hours per year to 263. For a project whose revenue tracks operating time, the financial impact scales accordingly.
When availability falls short, the failure often emerges from the interaction between subsystems — tied to how operation and maintenance responsibilities divide across the contract structure. The developer holds a system-level guarantee while the integrator pursues a supply chain dispute that may take months to resolve, during which the project continues to underperform.
The point of measurement: what the guarantee actually covers
Not all performance guarantees cover the same thing, even when they carry the same headline numbers. Battery suppliers naturally guarantee performance at the DC battery terminals — the boundary of their own equipment.
But a developer’s revenue depends on energy delivered at the medium- or high-voltage point of interconnection, after passing through the power conversion system, transformers, and site cabling.
Each of those steps loses energy to heat. A standard inverter runs at about 98.5% efficiency; silicon carbide inverters reach approximately 99%. Step-up transformers operate at roughly 99%; site cabling at roughly 99.9%.
These losses are universal and cumulative — and a guarantee measured at the DC terminals leaves the developer or EPC contractor responsible for absorbing all of them. If actual losses exceed what the project’s financial model assumed, the developer has no contractual recourse. For each cycle, these losses count twice: once during charging, and once during discharging.
Storage and delays: degradation begins before performance starts
Battery cells begin to age from the moment they leave the factory, regardless of whether they cycle. Calendar ageing — the gradual loss of capacity that occurs regardless of cycling — affects cells during transportation, on-site staging, and pre-commissioning delays.
A project that runs behind schedule starts commercial operation with less usable capacity than the model projected. This is a deficit that cannot be recovered.
Temperature control during storage carries a sharper risk. Exposure to temperatures outside the cell manufacturer’s specified range does not simply accelerate degradation — it can void the cell warranty entirely, leaving the EPC or developer without recourse against any party. A project that delays commissioning must ensure that whoever holds the batteries during that period bears clear contractual responsibility for maintaining environmental conditions within specification.
These guarantees protect developers only to the extent that developers understand what they actually cover — and where the gaps lie.
Part 2 of this series outlines the contracting, quality assurance, and operational strategies that close those gaps before they become claims.
About the Author
Yilin Huang is a senior energy storage engineer at market intelligence and technical advisory firm Intertek CEA. With more than 20 years of experience in renewable energy technology development, including advanced batteries and fuel cells, his work spans R&D, commercialisation, energy storage system integration, and technical consultancy on real-world project risks and performance. Before joining Intertek CEA, he worked for a system integrator and spent part of his early career in academia at the University of Maryland as a research professor. He holds a PhD in engineering.