

Sherif Abdelrazek, advisory board member at energy storage system modelling software company Storlytics, takes a look at one of the major challenges still faced in the BESS space: how to assess battery lifecycle.
Today, the development process for grid-tied battery systems faces many challenges. Amongst the most notable is the inability of developers to accurately estimate battery degradation prior to procurement from battery OEMs which happens well after the design phase.
As a result, a developer now depends on receiving project-specific accurate degradation data from battery cell suppliers, which is often time-consuming and not available before a purchase order is issued to the cell supplier.
In addition, the battery degradation models or generic degradation models from cell suppliers available during project planning are oversimplified and pose significant risks in project development. Because of these issues, developers find themselves locked in with one OEM and miss out on the opportunity to “shop” for the best battery product for the use case under consideration.
Try Premium for just $1
- Full premium access for the first month at only $1
- Converts to an annual rate after 30 days unless cancelled
- Cancel anytime during the trial period
Premium Benefits
- Expert industry analysis and interviews
- Digital access to PV Tech Power journal
- Exclusive event discounts
Or get the full Premium subscription right away
Or continue reading this article for free
The odds are that the selected battery product is not the best for the use case. And even if it is, you wouldn’t know that a side-by-side comparison of degradation estimates of different products (for the use-case at hand) was never performed.
Now, you may ask why battery energy storage developers are unable to do comparisons of various technology types for battery systems?
The answer is that there are no widely used accurate modeling tools (and battery models) available, for several reasons. For one, battery degradation modeling is extremely complex as it is highly non-linear. It depends on a slew of parameters like C-rate, energy throughput, calendar life, cell temperature, depth of discharge, cycle average, and center SoC (these are all just terms that affect the lifecycle of a battery system).
If that was not enough, battery OEMs spare no effort in protecting their degradation models and performance characteristics, unlike the solar industry, where PV panel PAN files are made available by both OEMs and third-party testing labs to be used in modeling software like PVsyst.
How to compare batteries from different OEMs for different use cases
The good news is that there are some solutions on the horizon! And some of them are more promising than others. Some consultants have turned to Flexible Performance Guarantee* (FPG) Scaling, and this is when consultants accumulate battery FPGs from OEMs from past projects and use the degradation estimates in them to extrapolate what degradation would look like for new projects with comparable (but not exactly the same) profiles.
For example, if you have an OEM FPG for Project A, and it shows a 2% yearly degradation for a battery profile with 1000MWh yearly throughput, you will assume that a new Project B with a 2000MWh yearly throughput would degrade 4% per year.
Quite simple, right? Not quite, this gross linear oversimplification does not consider how the 1000MWh and 2000MWh throughputs for projects A and B were dispatched. It dismisses a significant number of critical battery dispatch parameters (C-rate, DoD, Average SoC, Ambient, etc.) that heavily affect degradation.
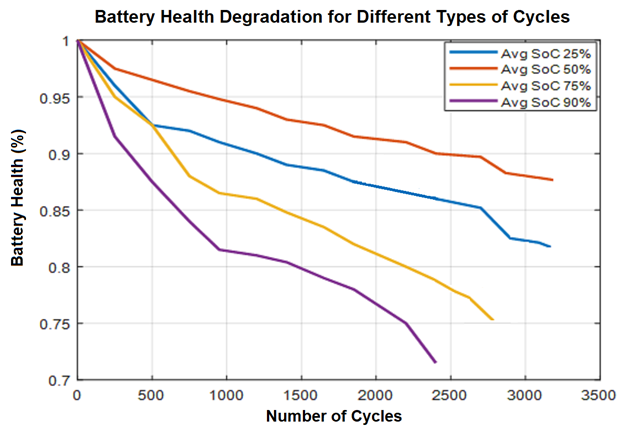
For instance, the curves shown below in Figure 1 were deduced from accelerated degradation tests for several similar lithium batteries that were all cycled at 10% Depth of Discharge (DoD) with different average SoCs.
To clarify, the blue curve with an average SoC of 25% implies that those batteries were continuously discharged and charged between 30% and 20% SoC.
Similarly, the orange curve indicates cycling between 55% and 45% SoC.
Notice something? They all have highly different degradation per cycle, even though they all ran a similar number of cycles (similar energy throughput)!
In the best case of the orange curve (Average SoC 50%), 2000 cycles got us to 92% battery health (SoH). In comparison, the worst case of the purple curve (Average SoC 90%) got us to 77% battery health for the same 2000 cycles (same energy throughput).
But how can developers get more accurate degradation estimates in the early design and financing phase of battery project development? And how can they select the optimal battery chemistry and OEM for specific use-cases early on?
Software tools like Storlytics Energy Storage are hitting the market that model battery systems’ degradation concerning more than just cycles or energy throughput. These tools can get developers one step closer to comparing battery OEMs performance for different use-cases (with cycles with varying Depth of Discharge, average SoC, ambient temperature, etc.).
Comparative battery system study
In a study performed by Storlytics Engineers in tandem with researchers at University of North Carolina at Charlotte, the benefits of accurately estimating battery degradation are presented.
In one of the studies, an NMC cell-based battery energy storage system (BESS) that performs multiple applications was considered. The planned number of days for ancillary grid services was 340 days in a year. And the BESS was expected to perform an upgrade deferral service where it provided energy arbitrage to a substantial portion of distribution customers for 25 days in a year.
The energy storage system project was rated at 5.5 MW of inverter capacity, and the energy needed throughout the project life was 5.5 MWh. This project was expected to have a lifetime of 10 years, and a battery overbuild strategy was adopted over augmentation.
Based on the planned application the battery was cycled mostly for ancillary services, and occasionally, during a grid peak load hour, provided energy arbitrage. Ancillary Service applications require the BESS to provide a high daily discharge throughput.
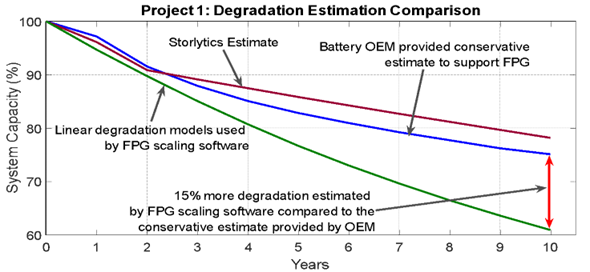
Figure 3 above shows the capacity degradation curves for BESS discussed above for different estimation methods currently available in the industry. The assumptions made in the estimation were that the BESS’s temperature and humidity were always within the recommended operating range.
Figure 3 shows that the estimate provided by the degradation modeling tool is remarkably close to the estimation provided by the OEM. It shows a little less degradation than what the battery OEM provided, as the OEM estimation includes some design margins.
So, the numbers provided by the battery OEM give a relatively conservative estimate. However, the estimation provided by commercial software, using FPG Scaling, predicted higher actual degradation. As the estimation for these models is solely based on throughput, they fail to capture non-linearity associated with cycle Depth of Discharge (DoD), average SoC, and Crates.
The FPG Scaling software showed around 15% more degradation for this project. The project’s beginning-of-life battery size was 9 MWh, and the cell OEM cannot provide a warranty if the capacity falls below 70%. If the developer used the estimate from FPG Scaling-based software, the project would need to be significantly oversized to ensure that the energy capacity does not fall below 70% at year 10.
This oversizing would have increased the project’s Capital Expenditure (CAPEX) and could create an unfavorable cost/benefit ratio for the investors as well utility customers.
‘No silver bullet’ for battery lifecycle assessment
So, is there a way to get higher accuracy early on to make an informed investment decision? The only better solution would be to have a credible lab execute accelerated degradation tests on each battery OEM product in consideration during battery system design. But this gets expensive and takes a long time because dozens, if not hundreds, of cells need to be cycled at varying cycle types (changing C-rate, DoD, average SoC, ambient temperature, etc.). Then results must be superimposed to deduce stress function parameters.
Aside from the complexity involved, this takes a long time, because you’re trying to run thousands of cycles for specific C-rates. Think of this, cycling at 1C, 1000 cycles take 2000 hours (one hour to charge and one hour to discharge), and cycling at 0.5C, the same cycle count takes 4000 hours (167 days).
Now, you may be patient and have the financial means to do this, but you have to keep in mind that battery OEMs update their products very frequently (6-18 months). So, it is very likely that your hard-earned test results and subsequent model will no longer be useful because that battery OEM doesn’t sell that product anymore!
So, where do we go from here? Although there is no silver bullet at this point, these new advanced battery degradation modeling tools are providing the level of accuracy that financiers and developers can be comfortable with and align with the OEMs conservative estimate.
One can only hope that these tools evolve and get adopted by the industry to a point where the standardised models in these tools will be noticed by battery OEMs and authenticated, similar to how PV panel manufacturers adopted and authenticated the .PAN model file format in PVsyst.
*Flexible Performance Guarantees (FPGs): A FPG is a warranty document that battery OEMs provide that guarantees how their cells will degrade if they were operated in the manner that the developer of the system described (most often through a battery profile/time-series).
In other words, it ties the throughput level that the developer estimated needing yearly to a guaranteed yearly battery energy capacity. Some FPGs also describe how the guaranteed yearly energy capacity will change if battery operators exceed the allowed yearly throughput.
About the Author
Sherif Abdelrazek PhD, PE, is an member of the advisory board at Storlytics, a maker of software for modelling battery energy storage systems headquartered in Atlanta, Georgia, US. It aims to help design, size and optimise grid-tied battery systems based on parameters like power and energy requirements for different use cases.
The author would like to extend special thanks to Dr. Jakir Hossain, Dr. Robin Bisht, Dr. Arun Suresh, Dr.Aniket Joshi & Prof. Sukumar Kamalasadan for deducing the degradation curves shown in this article. A very special thanks as well to the Energy Production and Infrastructure Center at UNC Charlotte for supporting this work.
This article has been amended from its original form to reflect the correct authorship.